Special Report: Global Warming of 1.5 ºC
Ch 00

Summary for Policymakers

Drafting Authors

  • Myles R. Allen (United Kingdom)
  • Mustafa Babiker (Sudan)
  • Yang Chen (China)
  • Heleen de Coninck (Netherlands)
  • Sarah Connors (France, United Kingdom)
  • Renée van Diemen (United Kingdom, Netherlands)
  • Opha Pauline Dube (Botswana)
  • Kristie L. Ebi (United States)
  • Francois Engelbrecht (South Africa)
  • Marion Ferrat (United Kingdom)
  • James Ford (United Kingdom, Canada)
  • Piers Forster (United Kingdom)
  • Sabine Fuss (Germany)
  • Tania Guillén Bolaños (Germany, Nicaragua)
  • Jordan Harold (United Kingdom)
  • Ove Hoegh-Guldberg (Australia)
  • Jean-Charles Hourcade (France)
  • Daniel Huppmann (Austria)
  • Daniela Jacob (Germany)
  • Kejun Jiang (China)
  • Tom Gabriel Johansen (Norway)
  • Mikiko Kainuma (Japan)
  • Kiane de Kleijne (Netherlands)
  • Elmar Kriegler (Germany)
  • Debora Ley (Guatemala, Mexico)
  • Diana Liverman (United States)
  • Nathalie Mahowald (United States)
  • Valérie Masson-Delmotte (France)
  • J.B. Robin Matthews (France, United Kingdom)
  • Richard J. Millar (United Kingdom)
  • Katja Mintenbeck (Germany)
  • Angela Morelli (Norway)
  • Wilfran Moufouma-Okia (France, Congo)
  • Luis Mundaca (Sweden, Chile)
  • Maike Nicolai (Germany)
  • Chukwumerije Okereke (United Kingdom, Nigeria)
  • Minal Pathak (India)
  • AntonyPayne (United Kingdom)
  • Roz Pidcock (France, United Kingdom)
  • Anna Pirani (Italy, United Kingdom)
  • Elvira Poloczanska (Germany, United Kingdom)
  • Hans-Otto Pörtner (Germany)
  • Aromar Revi (India)
  • Keywan Riahi (Austria)
  • Debra C. Roberts (South Africa)
  • Joeri Rogelj (Austria, Belgium)
  • Joyashree Roy (Thailand, India)
  • Sonia I. Seneviratne (Switzerland)
  • Priyadarshi R. Shukla (India)
  • James Skea (United Kingdom)
  • Raphael Slade (United Kingdom)
  • Drew Shindell (United States)
  • Chandni Singh (India)
  • William Solecki (United States)
  • Linda Steg (Netherlands)
  • Michael Taylor (Jamaica)
  • Petra Tschakert (Australia, Austria)
  • Henri Waisman (France)
  • Rachel Warren (United Kingdom)
  • Panmao Zhai (China)
  • Kirsten Zickfeld (Canada, Germany)
Figure SPM.1
View details
Figure SPM.2
View details
Figure SPM.3a
View details
Figure SPM.3b
View details
Figure SPM.4
View details
I

Introduction

This Report responds to the invitation for IPCC ‘… to provide a Special Report in 2018 on the impacts of global warming of 1.5°C above pre-industrial levels and related global greenhouse gas emission pathways’ contained in the Decision of the 21st Conference of Parties of the United Nations Framework Convention on Climate Change to adopt the Paris Agreement1.

The IPCC accepted the invitation in April 2016, deciding to prepare this Special Report on the impacts of global warming of 1.5°C above pre-industrial levels and related global greenhouse gas emission pathways, in the context of strengthening the global response to the threat of climate change, sustainable development, and efforts to eradicate poverty.

This Summary for Policymakers (SPM) presents the key findings of the Special Report, based on the assessment of the available scientific, technical and socio-economic literature2 relevant to global warming of 1.5°C and for the comparison between global warming of 1.5°C and 2°C above pre-industrial levels. The level of confidence associated with each key finding is reported using the IPCC calibrated language3. The underlying scientific basis of each key finding is indicated by references provided to chapter elements. In the SPM, knowledge gaps are identified associated with the underlying chapters of the Report.


Download the Headline Statements here

Changes to the Underlying Scientific-Technical Assessment to ensure consistency with the approved Summary for Policymakers

A

Understanding Global Warming of 1.5°C*

*Box SPM.1 Core Concepts Central to this report

A.1. Human activities are estimated to have caused approximately 1.0°C of global warming5 above pre-industrial levels, with a likely range of 0.8°C to 1.2°C. Global warming is likely to reach 1.5°C between 2030 and 2052 if it continues to increase at the current rate. (high confidence) (Figure SPM.1) {1.2}

A.1.1. Reflecting the long-term warming trend since pre-industrial times, observed global mean surface temperature (GMST) for the decade 2006–2015 was 0.87°C (likely between 0.75°C and 0.99°C)6 higher than the average over the 1850–1900 period (very high confidence). Estimated anthropogenic global warming matches the level of observed warming to within ±20% (likely range). Estimated anthropogenic global warming is currently increasing at 0.2°C (likely between 0.1°C and 0.3°C) per decade due to past and ongoing emissions (high confidence). {1.2.1, Table 1.1, 1.2.4}

A.1.2. Warming greater than the global annual average is being experienced in many land regions and seasons, including two to three times higher in the Arctic. Warming is generally higher over land than over the ocean. (high confidence) {1.2.1, 1.2.2, Figure 1.1, Figure 1.3, 3.3.1, 3.3.2}

A.1.3.  Trends in intensity and frequency of some climate and weather extremes have been detected over time spans during which about 0.5°C of global warming occurred (medium confidence). This assessment is based on several lines of evidence, including attribution studies for changes in extremes since 1950. {3.3.1, 3.3.2, 3.3.3}

A.2. Warming from anthropogenic emissions from the pre-industrial period to the present will persist for centuries to millennia and will continue to cause further long-term changes in the climate system, such as sea level rise, with associated impacts (high confidence), but these emissions alone are unlikely to cause global warming of 1.5°C (medium confidence). (Figure SPM.1) {1.2, 3.3, Figure 1.5}

 A.2.1. Anthropogenic emissions (including greenhouse gases, aerosols and their precursors) up to the present are unlikely to cause further warming of more than 0.5°C over the next two to three decades (high confidence) or on a century time scale (medium confidence). {1.2.4, Figure 1.5}

A.2.2. Reaching and sustaining net zero global anthropogenic CO2 emissions and declining net non-CO2 radiative forcing would halt anthropogenic global warming on multi-decadal times cales (high confidence). The maximum temperature reached is then determined by cumulative net global anthropogenic CO2 emissions up to the time of net zero CO2 emissions (high confidence) and the level of non-CO2 radiative forcing in the decades prior to the time that maximum temperatures are reached (medium confidence). On longer time scales, sustained net negative global anthropogenic CO2 emissions and/or further reductions in non-CO2 radiative forcing may still be required to prevent further warming due to Earth system feedbacks and to reverse ocean acidification (medium confidence) and will be required to minimize sea level rise (high confidence). {Cross-Chapter Box 2 in Chapter 1, 1.2.3, 1.2.4, Figure 1.4, 2.2.1, 2.2.2, 3.4.4.8, 3.4.5.1, 3.6.3.2}

A.3. Climate-related risks for natural and human systems are higher for global warming of 1.5°C than at present, but lower than at 2°C (high confidence). These risks depend on the magnitude and rate of warming, geographic location, levels of development and vulnerability, and on the choices and implementation of adaptation and mitigation options (high confidence). (Figure SPM.2) {1.3, 3.3, 3.4, 5.6}

A.3.1. Impacts on natural and human systems from global warming have already been observed (high confidence). Many land and ocean ecosystems and some of the services they provide have already changed due to global warming (high confidence). (Figure SPM.2) {1.4, 3.4, 3.5}

A.3.2. Future climate-related risks depend on the rate, peak and duration of warming. In the aggregate, they are larger if global warming exceeds 1.5°C before returning to that level by 2100 than if global warming gradually stabilizes at 1.5°C, especially if the peak temperature is high (e.g., about 2°C) (high confidence). Some impacts may be long-lasting or irreversible, such as the loss of some ecosystems (high confidence). {3.2, 3.4.4, 3.6.3, Cross-Chapter Box 8 in Chapter 3}

A.3.3. Adaptation and mitigation are already occurring (high confidence). Future climate-related risks would be reduced by the upscaling and acceleration of far-reaching, multilevel and cross-sectoral climate mitigation and by both incremental and transformational adaptation (high confidence). {1.2, 1.3, Table 3.5, 4.2.2, Cross-Chapter Box 9 in Chapter 4, Box 4.2, Box 4.3, Box 4.6, 4.3.1, 4.3.2, 4.3.3, 4.3.4, 4.3.5, 4.4.1, 4.4.4, 4.4.5, 4.5.3}

Figure SPM.1

Panel a: Observed monthly global mean surface temperature (GMST, grey line up to 2017, from the HadCRUT4, GISTEMP, Cowtan–Way, and NOAA datasets) change and estimated anthropogenic global warming (solid orange line up to 2017, with orange shading indicating assessed likely range). Orange dashed arrow and horizontal orange error bar show respectively the central estimate and […]

Panel a: Observed monthly global mean surface temperature (GMST, grey line up to 2017, from the HadCRUT4, GISTEMP, Cowtan–Way, and NOAA datasets) change and estimated anthropogenic global warming (solid orange line up to 2017, with orange shading indicating assessed likely range). Orange dashed arrow and horizontal orange error bar show respectively the central estimate and likely range of the time at which 1.5°C is reached if the current rate of warming continues. The grey plume on the right of panel a shows the likely range of warming responses, computed with a simple climate model, to a stylized pathway (hypothetical future) in which net CO2 emissions (grey line in panels b and c) decline in a straight line from 2020 to reach net zero in 2055 and net non-CO2 radiative forcing (grey line in panel d) increases to 2030 and then declines. The blue plume in panel a) shows the response to faster CO2 emissions reductions (blue line in panel b), reaching net zero in 2040, reducing cumulative CO2 emissions (panel c). The purple plume shows the response to net CO2 emissions declining to zero in 2055, with net non-CO2 forcing remaining constant after 2030. The vertical error bars on right of panel a) show the likely ranges (thin lines) and central terciles (33rd – 66th percentiles, thick lines) of the estimated distribution of warming in 2100 under these three stylized pathways. Vertical dotted error bars in panels b, c and d show the likely range of historical annual and cumulative global net CO2 emissions in 2017 (data from the Global Carbon Project) and of net non-CO2 radiative forcing in 2011 from AR5, respectively. Vertical axes in panels c and d are scaled to represent approximately equal effects on GMST. {1.2.1, 1.2.3, 1.2.4, 2.3, Figure 1.2 and Chapter 1 Supplementary Material, Cross-Chapter Box 2 in Chapter 1}

B

Projected Climate Change, Potential Impacts and Associated Risks

B.1. Climate models project robust7 differences in regional climate characteristics between present-day and global warming of 1.5°C8,and between 1.5°C and 2°C9. These differences include increases in: mean temperature in most land and ocean regions (high confidence), hot extremes in most inhabited regions (high confidence), heavy precipitation in several regions (medium confidence), and the probability of drought and precipitation deficits in some regions (medium confidence). {3.3}

B.1.1. Evidence from attributed changes in some climate and weather extremes for a global warming of about 0.5°C supports the assessment that an additional 0.5°C of warming compared to present is associated with further detectable changes in these extremes (medium confidence). Several regional changes in climate are assessed to occur with global warming up to 1.5°C compared to pre-industrial levels, including warming of extreme temperatures in many regions (high confidence), increases in frequency, intensity, and/or amount of heavy precipitation in several regions (high confidence), and an increase in intensity or frequency of droughts in some regions (medium confidence). {3.2, 3.3.1, 3.3.2, 3.3.3, 3.3.4, Table 3.2}

B.1.2. Temperature extremes on land are projected to warm more than GMST (high confidence): extreme hot days in mid-latitudes warm by up to about 3°C at global warming of 1.5°C and about 4°C at 2°C, and extreme cold nights in high latitudes warm by up to about 4.5°C at 1.5°C and about 6°C at 2°C (high confidence). The number of hot days is projected to increase in most land regions, with highest increases in the tropics (high confidence). {3.3.1, 3.3.2, Cross-Chapter Box 8 in Chapter 3}

B.1.3. Risks from droughts and precipitation deficits are projected to be higher at 2°C compared to 1.5°C of global warming in some regions (medium confidence). Risks from heavy precipitation events are projected to be higher at 2°C compared to 1.5°C of global warming in several northern hemisphere high-latitude and/or high-elevation regions, eastern Asia and eastern North America (medium confidence). Heavy precipitation associated with tropical cyclones is projected to be higher at 2°C compared to 1.5°C global warming (medium confidence). There is generally low confidence in projected changes in heavy precipitation at 2°C compared to 1.5°C in other regions. Heavy precipitation when aggregated at global scale is projected to be higher at 2°C than at 1.5°C of global warming (medium confidence). As a consequence of heavy precipitation, the fraction of the global land area affected by flood hazards is projected to be larger at 2°C compared to 1.5°C of global warming (medium confidence). {3.3.1, 3.3.3, 3.3.4, 3.3.5, 3.3.6}

B.2. By 2100, global mean sea level rise is projected to be around 0.1 metre lower with global warming of 1.5°C compared to 2°C (medium confidence). Sea level will continue to rise well beyond 2100 (high confidence), and the magnitude and rate of this rise depend on future emission pathways. A slower rate of sea level rise enables greater opportunities for adaptation in the human and ecological systems of small islands, low-lying coastal areas and deltas (medium confidence). {3.3, 3.4, 3.6}

B.2.1. Model-based projections of global mean sea level rise (relative to 1986–2005) suggest an indicative range of 0.26 to 0.77 m by 2100 for 1.5°C of global warming, 0.1 m (0.04–0.16 m) less than for a global warming of 2°C (medium confidence). A reduction of 0.1 m in global sea level rise implies that up to 10 million fewer people would be exposed to related risks, based on population in the year 2010 and assuming no adaptation (medium confidence). {3.4.4, 3.4.5, 4.3.2}

B.2.2. Sea level rise will continue beyond 2100 even if global warming is limited to 1.5°C in the 21st century (high confidence). Marine ice sheet instability in Antarctica and/or irreversible loss of the Greenland ice sheet could result in multi-metre rise in sea level over hundreds to thousands of years. These instabilities could be triggered at around 1.5°C to 2°C of global warming (medium confidence). (Figure SPM.2) {3.3.9, 3.4.5, 3.5.2, 3.6.3, Box 3.3}

B.2.3. Increasing warming amplifies the exposure of small islands, low-lying coastal areas and deltas to the risks associated with sea level rise for many human and ecological systems, including increased saltwater intrusion, flooding and damage to infrastructure (high confidence). Risks associated with sea level rise are higher at 2°C compared to 1.5°C. The slower rate of sea level rise at global warming of 1.5°C reduces these risks, enabling greater opportunities for adaptation including managing and restoring natural coastal ecosystems and infrastructure reinforcement (medium confidence). (Figure SPM.2) {3.4.5, Box 3.5}

B.3. On land, impacts on biodiversity and ecosystems, including species loss and extinction, are projected to be lower at 1.5°C of global warming compared to 2°C. Limiting global warming to 1.5°C compared to 2°C is projected to lower the impacts on terrestrial, freshwater and coastal ecosystems and to retain more of their services to humans (high confidence). (Figure SPM.2) {3.4, 3.5, Box 3.4, Box 4.2, Cross-Chapter Box 8 in Chapter 3}

B.3.1. Of 105,000 species studied10, 6% of insects, 8% of plants and 4% of vertebrates are projected to lose over half of their climatically determined geographic range for global warming of 1.5°C, compared with 18% of insects, 16% of plants and 8% of vertebrates for global warming of 2°C (medium confidence). Impacts associated with other biodiversity-related risks such as forest fires and the spread of invasive species are lower at 1.5°C compared to 2°C of global warming (high confidence). {3.4.3, 3.5.2}

B.3.2. Approximately 4% (interquartile range 2–7%) of the global terrestrial land area is projected to undergo a transformation of ecosystems from one type to another at 1°C of global warming, compared with 13% (interquartile range 8–20%) at 2°C (medium confidence). This indicates that the area at risk is projected to be approximately 50% lower at 1.5°C compared to 2°C (medium confidence). {3.4.3.1, 3.4.3.5}

B.3.3. High-latitude tundra and boreal forests are particularly at risk of climate change-induced degradation and loss, with woody shrubs already encroaching into the tundra (high confidence) and this will proceed with further warming. Limiting global warming to 1.5°C rather than 2°C is projected to prevent the thawing over centuries of a permafrost area in the range of 1.5 to 2.5 million km2 (medium confidence). {3.3.2, 3.4.3, 3.5.5}

B.4. Limiting global warming to 1.5°C compared to 2ºC is projected to reduce increases in ocean temperature as well as associated increases in ocean acidity and decreases in ocean oxygen levels (high confidence). Consequently, limiting global warming to 1.5°C is projected to reduce risks to marine biodiversity, fisheries, and ecosystems, and their functions and services to humans, as illustrated by recent changes to Arctic sea ice and warm-water coral reef ecosystems (high confidence). {3.3, 3.4, 3.5, Box 3.4, Box 3.5}

B.4.1. There is high confidence that the probability of a sea ice-free Arctic Ocean during summer is substantially lower at global warming of 1.5°C when compared to 2°C. With 1.5°C of global warming, one sea ice-free Arctic summer is projected per century. This likelihood is increased to at least one per decade with 2°C global warming. Effects of a temperature overshoot are reversible for Arctic sea ice cover on decadal time scales (high confidence). {3.3.8, 3.4.4.7}

B.4.2. Global warming of 1.5°C is projected to shift the ranges of many marine species to higher latitudes as well as increase the amount of damage to many ecosystems. It is also expected to drive the loss of coastal resources and reduce the productivity of fisheries and aquaculture (especially at low latitudes). The risks of climate-induced impacts are projected to be higher at 2°C than those at global warming of 1.5°C (high confidence). Coral reefs, for example, are projected to decline by a further 70–90% at 1.5°C (high confidence) with larger losses (>99%) at 2ºC (very high confidence). The risk of irreversible loss of many marine and coastal ecosystems increases with global warming, especially at 2°C or more (high confidence). {3.4.4, Box 3.4}

B.4.3. The level of ocean acidification due to increasing CO2 concentrations associated with global warming of 1.5°C is projected to amplify the adverse effects of warming, and even further at 2°C, impacting the growth, development, calcification, survival, and thus abundance of a broad range of species, for example, from algae to fish (high confidence). {3.3.10, 3.4.4}

B.4.4. Impacts of climate change in the ocean are increasing risks to fisheries and aquaculture via impacts on the physiology, survivorship, habitat, reproduction, disease incidence, and risk of invasive species (medium confidence) but are projected to be less at 1.5ºC of global warming than at 2ºC. One global fishery model, for example, projected a decrease in global annual catch for marine fisheries of about 1.5 million tonnes for 1.5°C of global warming compared to a loss of more than 3 million tonnes for 2°C of global warming (medium confidence). {3.4.4, Box 3.4}

B.5. Climate-related risks to health, livelihoods, food security, water supply, human security, and economic growth are projected to increase with global warming of 1.5°C and increase further with 2°C. (Figure SPM.2) {3.4, 3.5, 5.2, Box 3.2, Box 3.3, Box 3.5, Box 3.6, Cross-Chapter Box 6 in Chapter 3, Cross-Chapter Box 9 in Chapter 4, Cross-Chapter Box 12 in Chapter 5, 5.2}

 B.5.1. Populations at disproportionately higher risk of adverse consequences with global warming of 1.5°C and beyond include disadvantaged and vulnerable populations, some indigenous peoples, and local communities dependent on agricultural or coastal livelihoods (high confidence). Regions at disproportionately higher risk include Arctic ecosystems, dryland regions, small island developing states, and Least Developed Countries (high confidence). Poverty and disadvantage are expected to increase in some populations as global warming increases; limiting global warming to 1.5°C, compared with 2°C, could reduce the number of people both exposed to climate-related risks and susceptible to poverty by up to several hundred million by 2050 (medium confidence). {3.4.10, 3.4.11, Box 3.5, Cross-Chapter Box 6 in Chapter 3, Cross-Chapter Box 9 in Chapter 4, Cross-Chapter Box 12 in Chapter 5, 4.2.2.2, 5.2.1, 5.2.2, 5.2.3, 5.6.3}

B.5.2. Any increase in global warming is projected to affect human health, with primarily negative consequences (high confidence). Lower risks are projected at 1.5°C than at 2°C for heat-related morbidity and mortality (very high confidence) and for ozone-related mortality if emissions needed for ozone formation remain high (high confidence). Urban heat islands often amplify the impacts of heatwaves in cities (high confidence). Risks from some vector-borne diseases, such as malaria and dengue fever, are projected to increase with warming from 1.5°C to 2°C, including potential shifts in their geographic range (high confidence). {3.4.7, 3.4.8, 3.5.5.8}

B.5.3. Limiting warming to 1.5°C compared with 2°C is projected to result in smaller net reductions in yields of maize, rice, wheat, and potentially other cereal crops, particularly in sub-Saharan Africa, Southeast Asia, and Central and South America, and in the CO2-dependent nutritional quality of rice and wheat (high confidence). Reductions in projected food availability are larger at 2°C than at 1.5°C of global warming in the Sahel, southern Africa, the Mediterranean, central Europe, and the Amazon (medium confidence). Livestock are projected to be adversely affected with rising temperatures, depending on the extent of changes in feed quality, spread of diseases, and water resource availability (high confidence). {3.4.6, 3.5.4, 3.5.5, Box 3.1, Cross-Chapter Box 6 in Chapter 3, Cross-Chapter Box 9 in Chapter 4}

B.5.4. Depending on future socio-economic conditions, limiting global warming to 1.5°C compared to 2°C may reduce the proportion of the world population exposed to a climate change-induced increase in water stress by up to 50%, although there is considerable variability between regions (medium confidence). Many small island developing states could experience lower water stress as a result of projected changes in aridity when global warming is limited to 1.5°C, as compared to 2°C (medium confidence). {3.3.5, 3.4.2, 3.4.8, 3.5.5, Box 3.2, Box 3.5, Cross-Chapter Box 9 in Chapter 4}

 B.5.5. Risks to global aggregated economic growth due to climate change impacts are projected to be lower at 1.5°C than at 2°C by the end of this century11 (medium confidence). This excludes the costs of mitigation, adaptation investments and the benefits of adaptation. Countries in the tropics and Southern Hemisphere subtropics are projected to experience the largest impacts on economic growth due to climate change should global warming increase from 1.5°C to 2°C (medium confidence). {3.5.2, 3.5.3}

B.5.6. Exposure to multiple and compound climate-related risks increases between 1.5°C and 2°C of global warming, with greater proportions of people both so exposed and susceptible to poverty in Africa and Asia (high confidence). For global warming from 1.5°C to 2°C, risks across energy, food, and water sectors could overlap spatially and temporally, creating new and exacerbating current hazards, exposures, and vulnerabilities that could affect increasing numbers of people and regions (medium confidence). {Box 3.5, 3.3.1, 3.4.5.3, 3.4.5.6, 3.4.11, 3.5.4.9}

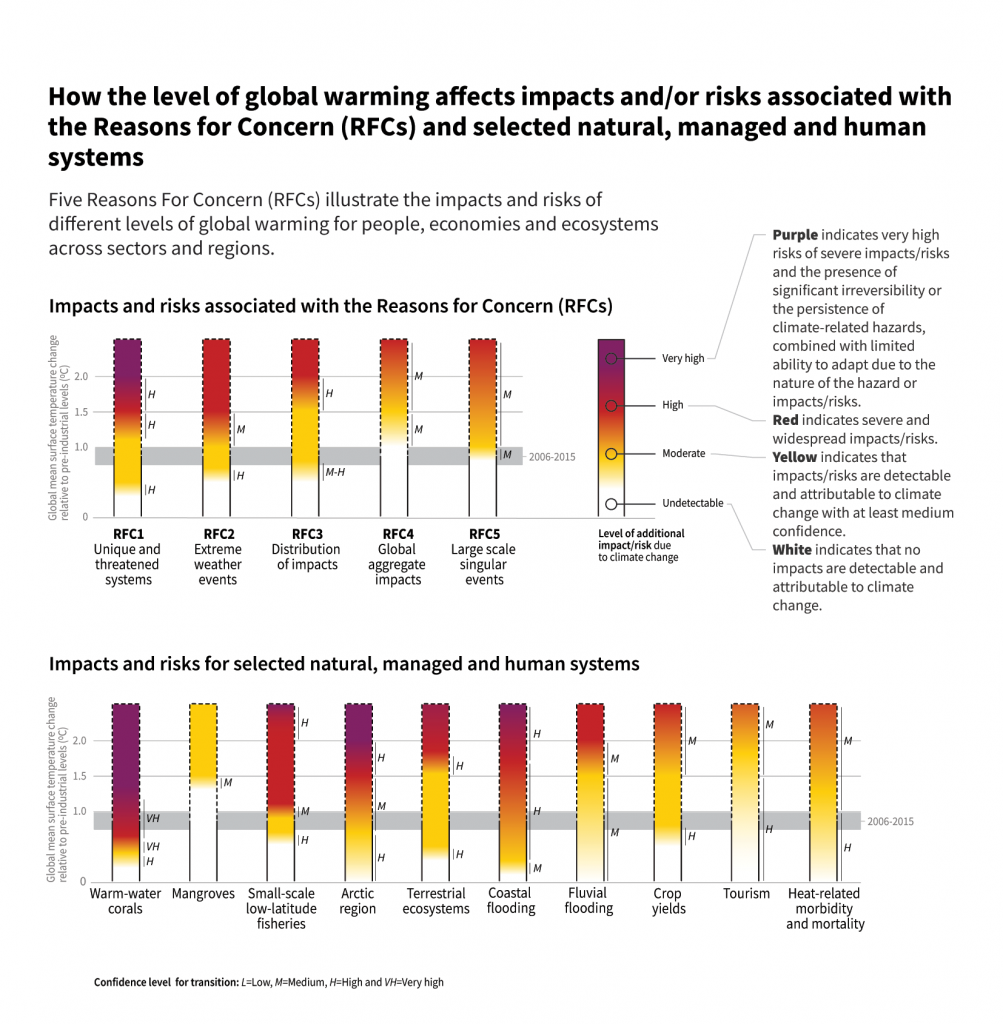
B.5.7. There are multiple lines of evidence that since AR5 the assessed levels of risk increased for four of the five Reasons for Concern (RFCs) for global warming to 2°C (high confidence). The risk transitions by degrees of global warming are now: from high to very high risk between 1.5°C and 2°C for RFC1 (Unique and threatened systems) (high confidence); from moderate to high risk between 1°C and 1.5°C for RFC2 (Extreme weather events) (medium confidence); from moderate to high risk between 1.5°C and 2°C for RFC3 (Distribution of impacts) (high confidence); from moderate to high risk between 1.5°C and 2.5°C for RFC4 (Global aggregate impacts) (medium confidence); and from moderate to high risk between 1°C and 2.5°C for RFC5 (Large-scale singular events) (medium confidence). (Figure SPM.2) {3.4.13; 3.5, 3.5.2}

B.6. Most adaptation needs will be lower for global warming of 1.5°C compared to 2°C (high confidence). There are a wide range of adaptation options that can reduce the risks of climate change (high confidence). There are limits to adaptation and adaptive capacity for some human and natural systems at global warming of 1.5°C, with associated losses (medium confidence). The number and availability of adaptation options vary by sector (medium confidence). {Table 3.5, 4.3, 4.5, Cross-Chapter Box 9 in Chapter 4, Cross-Chapter Box 12 in Chapter 5}

 B.6.1. A wide range of adaptation options are available to reduce the risks to natural and managed ecosystems (e.g., ecosystem-based adaptation, ecosystem restoration and avoided degradation and deforestation, biodiversity management, sustainable aquaculture, and local knowledge and indigenous knowledge), the risks of sea level rise (e.g., coastal defence and hardening), and the risks to health, livelihoods, food, water, and economic growth, especially in rural landscapes (e.g., efficient irrigation, social safety nets, disaster risk management, risk spreading and sharing, and community-based adaptation) and urban areas (e.g., green infrastructure, sustainable land use and planning, and sustainable water management) (medium confidence). {4.3.1, 4.3.2, 4.3.3, 4.3.5, 4.5.3, 4.5.4, 5.3.2, Box 4.2, Box 4.3, Box 4.6, Cross-Chapter Box 9 in Chapter 4}.

B.6.2. Adaptation is expected to be more challenging for ecosystems, food and health systems at 2°C of global warming than for 1.5°C (medium confidence). Some vulnerable regions, including small islands and Least Developed Countries, are projected to experience high multiple interrelated climate risks even at global warming of 1.5°C (high confidence). {3.3.1, 3.4.5, Box 3.5, Table 3.5, Cross-Chapter Box 9 in Chapter 4, 5.6, Cross-Chapter Box 12 in Chapter 5, Box 5.3}

B.6.3. Limits to adaptive capacity exist at 1.5°C of global warming, become more pronounced at higher levels of warming and vary by sector, with site-specific implications for vulnerable regions, ecosystems and human health (medium confidence). {Cross-Chapter Box 12 in Chapter 5, Box 3.5, Table 3.5}

Figure SPM.2

Five integrative reasons for concern (RFCs) provide a framework for summarizing key impacts and risks across sectors and regions, and were introduced in the IPCC Third Assessment Report. RFCs illustrate the implications of global warming for people, economies and ecosystems. Impacts and/or risks for each RFC are based on assessment of the new literature that […]

Five integrative reasons for concern (RFCs) provide a framework for summarizing key impacts and risks across sectors and regions, and were introduced in the IPCC Third Assessment Report. RFCs illustrate the implications of global warming for people, economies and ecosystems. Impacts and/or risks for each RFC are based on assessment of the new literature that has appeared. As in AR5, this literature was used to make expert judgments to assess the levels of global warming at which levels of impact and/or risk are undetectable, moderate, high or very high. The selection of impacts and risks to natural, managed and human systems in the lower panel is illustrative and is not intended to be fully comprehensive. {3.4, 3.5, 3.5.2.1, 3.5.2.2, 3.5.2.3, 3.5.2.4, 3.5.2.5, 5.4.1 5.5.3, 5.6.1, Box 3.4}

RFC1 Unique and threatened systems: ecological and human systems that have restricted geographic ranges constrained by climate-related conditions and have high endemism or other distinctive properties. Examples include coral reefs, the Arctic and its indigenous people, mountain glaciers and biodiversity hotspots.

RFC2 Extreme weather events: risks/impacts to human health, livelihoods, assets and ecosystems from extreme weather events such as heat waves, heavy rain, drought and associated wildfires, and coastal flooding.

RFC3 Distribution of impacts: risks/impacts that disproportionately affect particular groups due to uneven distribution of physical climate change hazards, exposure or vulnerability.

RFC4 Global aggregate impacts: global monetary damage, global-scale degradation and loss of ecosystems and biodiversity.

RFC5 Large-scale singular events: are relatively large, abrupt and sometimes irreversible changes in systems that are caused by global warming. Examples include disintegration of the Greenland and Antarctic ice sheets.

C

Emission Pathways and System Transitions Consistent with 1.5°C Global Warming

C.1. In model pathways with no or limited overshoot of 1.5°C, global net anthropogenic CO2 emissions decline by about 45% from 2010 levels by 2030 (40–60% interquartile range), reaching net zero around 2050 (2045–2055 interquartile range). For limiting global warming to below 2°C 12 CO2 emissions are projected to decline by about 25% by 2030 in most pathways (10–30% interquartile range) and reach net zero around 2070 (2065–2080 interquartile range). Non-CO2 emissions in pathways that limit global warming to 1.5°C show deep reductions that are similar to those in pathways limiting warming to 2°C. (high confidence) (Figure SPM.3a) {2.1, 2.3, Table 2.4}

C.1.1. CO2 emissions reductions that limit global warming to 1.5°C with no or limited overshoot can involve different portfolios of mitigation measures, striking different balances between lowering energy and resource intensity, rate of decarbonization, and the reliance on carbon dioxide removal. Different portfolios face different implementation challenges and potential synergies and trade-offs with sustainable development. (high confidence). (Figure SPM.3b) {2.3.2, 2.3.4, 2.4, 2.5.3}

C.1.2. Modelled pathways that limit global warming to 1.5°C with no or limited overshoot involve deep reductions in emissions of methane and black carbon (35% or more of both by 2050 relative to 2010). These pathways also reduce most of the cooling aerosols, which partially offsets mitigation effects for two to three decades. Non-CO2 emissions13 can be reduced as a result of broad mitigation measures in the energy sector. In addition, targeted non-CO2 mitigation measures can reduce nitrous oxide and methane from agriculture, methane from the waste sector, some sources of black carbon, and hydrofluorocarbons. High bioenergy demand can increase emissions of nitrous oxide in some 1.5°C pathways, highlighting the importance of appropriate management approaches. Improved air quality resulting from projected reductions in many non-CO2 emissions provide direct and immediate population health benefits in all 1.5°C model pathways. (high confidence) (Figure SPM.3a) {2.2.1, 2.3.3, 2.4.4, 2.5.3, 4.3.6, 5.4.2}

C.1.3. Limiting global warming requires limiting the total cumulative global anthropogenic emissions of CO2 since the pre-industrial period, that is, staying within a total carbon budget (high confidence).14By the end of 2017, anthropogenic CO2 emissions since the pre-industrial period are estimated to have reduced the total carbon budget for 1.5°C by approximately 2200 ± 320 GtCO2 (medium confidence). The associated remaining budget is being depleted by current emissions of 42 ± 3 GtCO2 per year (high confidence). The choice of the measure of global temperature affects the estimated remaining carbon budget. Using global mean surface air temperature, as in AR5, gives an estimate of the remaining carbon budget of 580 GtCO2 for a 50% probability of limiting warming to 1.5°C, and 420 GtCO2 for a 66% probability (medium confidence).15Alternatively, using GMST gives estimates of 770 and 570 GtCO2, for 50% and 66% probabilities,16respectively (medium confidence). Uncertainties in the size of these estimated remaining carbon budgets are substantial and depend on several factors. Uncertainties in the climate response to CO2 and non-CO2 emissions contribute ±400 GtCO2 and the level of historic warming contributes ±250 GtCO2 (medium confidence). Potential additional carbon release from future permafrost thawing and methane release from wetlands would reduce budgets by up to 100 GtCO2 over the course of this century and more thereafter (medium confidence). In addition, the level of non-CO2 mitigation in the future could alter the remaining carbon budget by 250 GtCO2 in either direction (medium confidence). {1.2.4, 2.2.2, 2.6.1, Table 2.2, Chapter 2 Supplementary Material}

C.1.4. Solar radiation modification (SRM) measures are not included in any of the available assessed pathways. Although some SRM measures may be theoretically effective in reducing an overshoot, they face large uncertainties and knowledge gaps as well as substantial risks and institutional and social constraints to deployment related to governance, ethics, and impacts on sustainable development. They also do not mitigate ocean acidification. (medium confidence). {4.3.8, Cross-Chapter Box 10 in Chapter 4}

Figure SPM.3a

The main panel shows global net anthropogenic CO2 emissions in pathways limiting global warming to 1.5°C with no or limited (less than 0.1°C) overshoot and pathways with higher overshoot. The shaded area shows the full range for pathways analysed in this Report. The panels on the right show non-CO2 emissions ranges for three compounds with […]

The main panel shows global net anthropogenic CO2 emissions in pathways limiting global warming to 1.5°C with no or limited (less than 0.1°C) overshoot and pathways with higher overshoot. The shaded area shows the full range for pathways analysed in this Report. The panels on the right show non-CO2 emissions ranges for three compounds with large historical forcing and a substantial portion of emissions coming from sources distinct from those central to CO2 mitigation. Shaded areas in these panels show the 5–95% (light shading) and interquartile (dark shading) ranges of pathways limiting global warming to 1.5°C with no or limited overshoot. Box and whiskers at the bottom of the figure show the timing of pathways reaching global net zero CO2 emission levels, and a comparison with pathways limiting global warming to 2°C with at least 66% probability. Four illustrative model pathways are highlighted in the main panel and are labelled P1, P2, P3 and P4, corresponding to the LED, S1, S2, and S5 pathways assessed in Chapter 2. Descriptions and characteristics of these pathways are available in Figure SPM.3b. {2.1, 2.2, 2.3, Figure 2.5, Figure 2.10, Figure 2.11}

Figure SPM.3b

Characteristics of four illustrative model pathways in relation to global warming of 1.5°C introduced in Figure SPM.3a.  These pathways were selected to show a range of potential mitigation approaches and vary widely in their projected energy and land use, as well as their assumptions about future socio-economic developments, including economic and population growth, equity and […]

Characteristics of four illustrative model pathways in relation to global warming of 1.5°C introduced in Figure SPM.3a.  These pathways were selected to show a range of potential mitigation approaches and vary widely in their projected energy and land use, as well as their assumptions about future socio-economic developments, including economic and population growth, equity and sustainability. A breakdown of the global net anthropogenic CO2 emissions into the contributions in terms of CO2 emissions from fossil fuel and industry; agriculture, forestry and other land use (AFOLU); and bioenergy with carbon capture and storage (BECCS) is shown. AFOLU estimates reported here are not necessarily comparable with countries’ estimates. Further characteristics for each of these pathways are listed below each pathway. These pathways illustrate relative global differences in mitigation strategies, but do not represent central estimates, national strategies, and do not indicate requirements. For comparison, the right-most column shows the interquartile ranges across pathways with no or limited overshoot of 1.5°C. Pathways P1, P2, P3 and P4 correspond to the LED, S1, S2, and S5 pathways assessed in Chapter 2 (Figure SPM.3a). {2.2.1, 2.3.1, 2.3.2, 2.3.3, 2.3.4, 2.4.1, 2.4.2, 2.4.4, 2.5.3, Figure 2.5, Figure 2.6, Figure 2.9, Figure 2.10, Figure 2.11, Figure 2.14, Figure 2.15, Figure 2.16, Figure 2.17, Figure 2.24, Figure 2.25, Table 2.4, Table 2.6, Table 2.7, Table 2.9, Table 4.1}

C.2. Pathways limiting global warming to 1.5°C with no or limited overshoot would require rapid and far-reaching transitions in energy, land, urban and infrastructure (including transport and buildings), and industrial systems (high confidence). These systems transitions are unprecedented in terms of scale, but not necessarily in terms of speed, and imply deep emissions reductions in all sectors, a wide portfolio of mitigation options and a significant upscaling of investments in those options (medium confidence). {2.3, 2.4, 2.5, 4.2, 4.3, 4.4, 4.5}

C.2.1. Pathways that limit global warming to 1.5°C with no or limited overshoot show system changes that are more rapid and pronounced over the next two decades than in 2°C pathways (high confidence). The rates of system changes associated with limiting global warming to 1.5°C with no or limited overshoot have occurred in the past within specific sectors, technologies and spatial contexts, but there is no documented historic precedent for their scale (medium confidence). {2.3.3, 2.3.4, 2.4, 2.5, 4.2.1, 4.2.2, Cross-Chapter Box 11 in Chapter 4}

C.2.2. In energy systems, modelled global pathways (considered in the literature) limiting global warming to 1.5°C with no or limited overshoot (for more details see Figure SPM.3b) generally meet energy service demand with lower energy use, including through enhanced energy efficiency, and show faster electrification of energy end use compared to 2°C (high confidence). In 1.5°C pathways with no or limited overshoot, low-emission energy sources are projected to have a higher share, compared with 2°C pathways, particularly before 2050 (high confidence). In 1.5°C pathways with no or limited overshoot, renewables are projected to supply 70–85% (interquartile range) of electricity in 2050 (high confidence). In electricity generation, shares of nuclear and fossil fuels with carbon dioxide capture and storage (CCS) are modelled to increase in most 1.5°C pathways with no or limited overshoot. In modelled 1.5°C pathways with limited or no overshoot, the use of CCS would allow the electricity generation share of gas to be approximately 8% (3–11% interquartile range) of global electricity in 2050, while the use of coal shows a steep reduction in all pathways and would be reduced to close to 0% (0–2% interquartile range) of electricity (high confidence). While acknowledging the challenges, and differences between the options and national circumstances, political, economic, social and technical feasibility of solar energy, wind energy and electricity storage technologies have substantially improved over the past few years (high confidence). These improvements signal a potential system transition in electricity generation. (Figure SPM.3b) {2.4.1, 2.4.2, Figure 2.1, Table 2.6, Table 2.7, Cross-Chapter Box 6 in Chapter 3, 4.2.1, 4.3.1, 4.3.3, 4.5.2}

C.2.3. CO2 emissions from industry in pathways limiting global warming to 1.5°C with no or limited overshoot are projected to be about 65–90% (interquartile range) lower in 2050 relative to 2010, as compared to 50–80% for global warming of 2°C (medium confidence). Such reductions can be achieved through combinations of new and existing technologies and practices, including electrification, hydrogen, sustainable bio-based feedstocks, product substitution, and carbon capture, utilization and storage (CCUS). These options are technically proven at various scales but their large-scale deployment may be limited by economic, financial, human capacity and institutional constraints in specific contexts, and specific characteristics of large-scale industrial installations. In industry, emissions reductions by energy and process efficiency by themselves are insufficient for limiting warming to 1.5°C with no or limited overshoot (high confidence). {2.4.3, 4.2.1, Table 4.1, Table 4.3, 4.3.3, 4.3.4, 4.5.2}

C.2.4. The urban and infrastructure system transition consistent with limiting global warming to 1.5°C with no or limited overshoot would imply, for example, changes in land and urban planning practices, as well as deeper emissions reductions in transport and buildings compared to pathways that limit global warming below 2°C (medium confidence). Technical measures and practices enabling deep emissions reductions include various energy efficiency options. In pathways limiting global warming to 1.5°C with no or limited overshoot, the electricity share of energy demand in buildings would be about 55–75% in 2050 compared to 50–70% in 2050 for 2°C global warming (medium confidence). In the transport sector, the share of low-emission final energy would rise from less than 5% in 2020 to about 35–65% in 2050 compared to 25–45% for 2°C of global warming (medium confidence). Economic, institutional and socio-cultural barriers may inhibit these urban and infrastructure system transitions, depending on national, regional and local circumstances, capabilities and the availability of capital (high confidence). {2.3.4, 2.4.3, 4.2.1, Table 4.1, 4.3.3, 4.5.2}

C.2.5. Transitions in global and regional land use are found in all pathways limiting global warming to 1.5°C with no or limited overshoot, but their scale depends on the pursued mitigation portfolio. Model pathways that limit global warming to 1.5°C with no or limited overshoot project a 4 million km2 reduction to a 2.5 million km2 increase of non-pasture agricultural land for food and feed crops and a 0.5–11 million km2 reduction of pasture land, to be converted into a 0–6 million km2 increase of agricultural land for energy crops and a 2 million km2 reduction to 9.5 million km2 increase in forests by 2050 relative to 2010 (medium confidence)17. Land-use transitions of similar magnitude can be observed in modelled 2°C pathways (medium confidence). Such large transitions pose profound challenges for sustainable management of the various demands on land for human settlements, food, livestock feed, fibre, bioenergy, carbon storage, biodiversity and other ecosystem services (high confidence). Mitigation options limiting the demand for land include sustainable intensification of land-use practices, ecosystem restoration and changes towards less resource-intensive diets (high confidence). The implementation of land-based mitigation options would require overcoming socio-economic, institutional, technological, financing and environmental barriers that differ across regions (high confidence). {2.4.4, Figure 2.24, 4.3.2, 4.3.7, 4.5.2, Cross-Chapter Box 7 in Chapter 3}

C.2.6. Additional annual average energy-related investments for the period 2016 to 2050 in pathways limiting warming to 1.5°C compared to pathways without new climate policies beyond those in place today are estimated to be around 830 billion USD2010 (range of 150 billion to 1700 billion USD2010 across six models)18. This compares to total annual average energy supply investments in 1.5°C pathways of 1460 to 3510 billion USD2010 and total annual average energy demand investments of 640 to 910 billion USD2010 for the period 2016 to 2050. Total energy-related investments increase by about 12% (range of 3% to 24%) in 1.5°C pathways relative to 2°C pathways. Annual investments in low-carbon energy technologies and energy efficiency are upscaled by roughly a factor of six (range of factor of 4 to 10) by 2050 compared to 2015 (medium confidence). {2.5.2, Box 4.8, Figure 2.27}

C.2.7. Modelled pathways limiting global warming to 1.5°C with no or limited overshoot project a wide range of global average discounted marginal abatement costs over the 21st century. They are roughly 3-4 times higher than in pathways limiting global warming to below 2°C (high confidence). The economic literature distinguishes marginal abatement costs from total mitigation costs in the economy. The literature on total mitigation costs of 1.5°C mitigation pathways is limited and was not assessed in this Report. Knowledge gaps remain in the integrated assessment of the economy-wide costs and benefits of mitigation in line with pathways limiting warming to 1.5°C. {2.5.2; 2.6; Figure 2.26}

C.3. All pathways that limit global warming to 1.5°C with limited or no overshoot project the use of carbon dioxide removal (CDR) on the order of 100–1000 GtCO2 over the 21st century. CDR would be used to compensate for residual emissions and, in most cases, achieve net negative emissions to return global warming to 1.5°C following a peak (high confidence). CDR deployment of several hundreds of GtCO2 is subject to multiple feasibility and sustainability constraints (high confidence). Significant near-term emissions reductions and measures to lower energy and land demand can limit CDR deployment to a few hundred GtCO2 without reliance on bioenergy with carbon capture and storage (BECCS) (high confidence). {2.3, 2.4, 3.6.2, 4.3, 5.4}

 C.3.1. Existing and potential CDR measures include afforestation and reforestation, land restoration and soil carbon sequestration, BECCS, direct air carbon capture and storage (DACCS), enhanced weathering and ocean alkalinization. These differ widely in terms of maturity, potentials, costs, risks, co-benefits and trade-offs (high confidence). To date, only a few published pathways include CDR measures other than afforestation and BECCS. {2.3.4, 3.6.2, 4.3.2, 4.3.7}

C.3.2. In pathways limiting global warming to 1.5°C with limited or no overshoot, BECCS deployment is projected to range from 0–1, 0–8, and 0–16 GtCO2 yr−1 in 2030, 2050, and 2100, respectively, while agriculture, forestry and land-use (AFOLU) related CDR measures are projected to remove 0–5, 1–11, and 1–5 GtCO2 yr−1 in these years (medium confidence). The upper end of these deployment ranges by mid-century exceeds the BECCS potential of up to 5 GtCO2 yr−1 and afforestation potential of up to 3.6 GtCO2 yr−1 assessed based on recent literature (medium confidence). Some pathways avoid BECCS deployment completely through demand-side measures and greater reliance on AFOLU-related CDR measures (medium confidence). The use of bioenergy can be as high or even higher when BECCS is excluded compared to when it is included due to its potential for replacing fossil fuels across sectors (high confidence). (Figure SPM.3b) {2.3.3, 2.3.4, 2.4.2, 3.6.2, 4.3.1, 4.2.3, 4.3.2, 4.3.7, 4.4.3, Table 2.4}

 C.3.3. Pathways that overshoot 1.5°C of global warming rely on CDR exceeding residual CO2 emissions later in the century to return to below 1.5°C by 2100, with larger overshoots requiring greater amounts of CDR (Figure SPM.3b) (high confidence). Limitations on the speed, scale, and societal acceptability of CDR deployment hence determine the ability to return global warming to below 1.5°C following an overshoot. Carbon cycle and climate system understanding is still limited about the effectiveness of net negative emissions to reduce temperatures after they peak (high confidence). {2.2, 2.3.4, 2.3.5, 2.6, 4.3.7, 4.5.2, Table 4.11}

C.3.4. Most current and potential CDR measures could have significant impacts on land, energy, water or nutrients if deployed at large scale (high confidence). Afforestation and bioenergy may compete with other land uses and may have significant impacts on agricultural and food systems, biodiversity, and other ecosystem functions and services (high confidence). Effective governance is needed to limit such trade-offs and ensure permanence of carbon removal in terrestrial, geological and ocean reservoirs (high confidence). Feasibility and sustainability of CDR use could be enhanced by a portfolio of options deployed at substantial, but lesser scales, rather than a single option at very large scale (high confidence). (Figure SPM.3b) {2.3.4, 2.4.4, 2.5.3, 2.6, 3.6.2, 4.3.2, 4.3.7, 4.5.2, 5.4.1, 5.4.2; Cross-Chapter Boxes 7 and 8 in Chapter 3, Table 4.11, Table 5.3, Figure 5.3}

C.3.5. Some AFOLU-related CDR measures such as restoration of natural ecosystems and soil carbon sequestration could provide co-benefits such as improved biodiversity, soil quality, and local food security. If deployed at large scale, they would require governance systems enabling sustainable land management to conserve and protect land carbon stocks and other ecosystem functions and services (medium confidence). (Figure SPM.4) {2.3.3, 2.3.4, 2.4.2, 2.4.4, 3.6.2, 5.4.1, Cross-Chapter Boxes 3 in Chapter 1 and 7 in Chapter 3, 4.3.2, 4.3.7, 4.4.1, 4.5.2, Table 2.4}

D

Strengthening the Global Response in the Context of Sustainable Development and Efforts to Eradicate Poverty

D.1. Estimates of the global emissions outcome of current nationally stated mitigation ambitions as submitted under the Paris Agreement would lead to global greenhouse gas emissions19 in 2030 of 52–58 GtCO2eq yr1 (medium confidence). Pathways reflecting these ambitions would not limit global warming to 1.5°C, even if supplemented by very challenging increases in the scale and ambition of emissions reductions after 2030 (high confidence). Avoiding overshoot and reliance on future large-scale deployment of carbon dioxide removal (CDR) can only be achieved if global CO2 emissions start to decline well before 2030 (high confidence). {1.2, 2.3, 3.3, 3.4, 4.2, 4.4, Cross-Chapter Box 11 in Chapter 4}

D.1.1. Pathways that limit global warming to 1.5°C with no or limited overshoot show clear emission reductions by 2030 (high confidence). All but one show a decline in global greenhouse gas emissions to below 35 GtCO2eq yr−1 in 2030, and half of available pathways fall within the 25–30 GtCO2eq yr−1 range (interquartile range), a 40–50% reduction from 2010 levels (high confidence). Pathways reflecting current nationally stated mitigation ambition until 2030 are broadly consistent with cost-effective pathways that result in a global warming of about 3°C by 2100, with warming continuing afterwards (medium confidence). {2.3.3, 2.3.5, Cross-Chapter Box 11 in Chapter 4, 5.5.3.2}

D.1.2. Overshoot trajectories result in higher impacts and associated challenges compared to pathways that limit global warming to 1.5°C with no or limited overshoot (high confidence). Reversing warming after an overshoot of 0.2°C or larger during this century would require upscaling and deployment of CDR at rates and volumes that might not be achievable given considerable implementation challenges (medium confidence). {1.3.3, 2.3.4, 2.3.5, 2.5.1, 3.3, 4.3.7, Cross-Chapter Box 8 in Chapter 3, Cross-Chapter Box 11 in Chapter 4}

D.1.3. The lower the emissions in 2030, the lower the challenge in limiting global warming to 1.5°C after 2030 with no or limited overshoot (high confidence). The challenges from delayed actions to reduce greenhouse gas emissions include the risk of cost escalation, lock-in in carbon-emitting infrastructure, stranded assets, and reduced flexibility in future response options in the medium to long term (high confidence). These may increase uneven distributional impacts between countries at different stages of development (medium confidence). {2.3.5, 4.4.5, 5.4.2}

D.2. The avoided climate change impacts on sustainable development, eradication of poverty and reducing inequalities would be greater if global warming were limited to 1.5°C rather than 2°C, if mitigation and adaptation synergies are maximized while trade-offs are minimized (high confidence). {1.1, 1.4, 2.5, 3.3, 3.4, 5.2, Table 5.1}

D.2.1. Climate change impacts and responses are closely linked to sustainable development which balances social well-being, economic prosperity and environmental protection. The United Nations Sustainable Development Goals (SDGs), adopted in 2015, provide an established framework for assessing the links between global warming of 1.5°C or 2°C and development goals that include poverty eradication, reducing inequalities, and climate action. (high confidence) {Cross-Chapter Box 4 in Chapter 1, 1.4, 5.1}

D.2.2. The consideration of ethics and equity can help address the uneven distribution of adverse impacts associated with 1.5°C and higher levels of global warming, as well as those from mitigation and adaptation, particularly for poor and disadvantaged populations, in all societies (high confidence). {1.1.1, 1.1.2, 1.4.3, 2.5.3, 3.4.10, 5.1, 5.2, 5.3. 5.4, Cross-Chapter Box 4 in Chapter 1, Cross-Chapter Boxes 6 and 8 in Chapter 3, and Cross-Chapter Box 12 in Chapter 5}

D.2.3. Mitigation and adaptation consistent with limiting global warming to 1.5°C are underpinned by enabling conditions, assessed in this Report across the geophysical, environmental-ecological, technological, economic, socio-cultural and institutional dimensions of feasibility. Strengthened multilevel governance, institutional capacity, policy instruments, technological innovation and transfer and mobilization of finance, and changes in human behaviour and lifestyles are enabling conditions that enhance the feasibility of mitigation and adaptation options for 1.5°C-consistent systems transitions. (high confidence) {1.4, Cross-Chapter Box 3 in Chapter 1, 2.5.1, 4.4, 4.5, 5.6}

D.3. Adaptation options specific to national contexts, if carefully selected together with enabling conditions, will have benefits for sustainable development and poverty reduction with global warming of 1.5°C, although trade-offs are possible (high confidence). {1.4, 4.3, 4.5}

D.3.1. Adaptation options that reduce the vulnerability of human and natural systems have many synergies with sustainable development, if well managed, such as ensuring food and water security, reducing disaster risks, improving health conditions, maintaining ecosystem services and reducing poverty and inequality (high confidence). Increasing investment in physical and social infrastructure is a key enabling condition to enhance the resilience and the adaptive capacities of societies. These benefits can occur in most regions with adaptation to 1.5°C of global warming (high confidence). {1.4.3, 4.2.2, 4.3.1, 4.3.2, 4.3.3, 4.3.5, 4.4.1, 4.4.3, 4.5.3, 5.3.1, 5.3.2}

D.3.2. Adaptation to 1.5°C global warming can also result in trade-offs or maladaptations with adverse impacts for sustainable development. For example, if poorly designed or implemented, adaptation projects in a range of sectors can increase greenhouse gas emissions and water use, increase gender and social inequality, undermine health conditions, and encroach on natural ecosystems (high confidence). These trade-offs can be reduced by adaptations that include attention to poverty and sustainable development (high confidence). {4.3.2, 4.3.3, 4.5.4, 5.3.2; Cross-Chapter Boxes 6 and 7 in Chapter 3}

D.3.3. A mix of adaptation and mitigation options to limit global warming to 1.5°C, implemented in a participatory and integrated manner, can enable rapid, systemic transitions in urban and rural areas (high confidence). These are most effective when aligned with economic and sustainable development, and when local and regional governments and decision makers are supported by national governments (medium confidence). {4.3.2, 4.3.3, 4.4.1, 4.4.2}

D.3.4. Adaptation options that also mitigate emissions can provide synergies and cost savings in most sectors and system transitions, such as when land management reduces emissions and disaster risk, or when low-carbon buildings are also designed for efficient cooling. Trade-offs between mitigation and adaptation, when limiting global warming to 1.5°C, such as when bioenergy crops, reforestation or afforestation encroach on land needed for agricultural adaptation, can undermine food security, livelihoods, ecosystem functions and services and other aspects of sustainable development. (high confidence) {3.4.3, 4.3.2, 4.3.4, 4.4.1, 4.5.2, 4.5.3, 4.5.4}

D.4. Mitigation options consistent with 1.5°C pathways are associated with multiple synergies and trade-offs across the Sustainable Development Goals (SDGs). While the total number of possible synergies exceeds the number of trade-offs, their net effect will depend on the pace and magnitude of changes, the composition of the mitigation portfolio and the management of the transition. (high confidence) (Figure SPM.4) {2.5, 4.5, 5.4}

D.4.1. 1.5°C pathways have robust synergies particularly for the SDGs 3 (health), 7 (clean energy), 11 (cities and communities), 12 (responsible consumption and production) and 14 (oceans) (very high confidence). Some 1.5°C pathways show potential trade-offs with mitigation for SDGs 1 (poverty), 2 (hunger), 6 (water) and 7 (energy access), if not managed carefully (high confidence). (Figure SPM.4) {5.4.2; Figure 5.4, Cross-Chapter Boxes 7 and 8 in Chapter 3}

D.4.2. 1.5°C pathways that include low energy demand (e.g., see P1 in Figure SPM.3a and SPM.3b), low material consumption, and low GHG-intensive food consumption have the most pronounced synergies and the lowest number of trade-offs with respect to sustainable development and the SDGs (high confidence). Such pathways would reduce dependence on CDR. In modelled pathways, sustainable development, eradicating poverty and reducing inequality can support limiting warming to 1.5°C (high confidence). (Figure SPM.3b, Figure SPM.4) {2.4.3, 2.5.1, 2.5.3, Figure 2.4, Figure 2.28, 5.4.1, 5.4.2, Figure 5.4}

D.4.3. 1.5°C and 2°C modelled pathways often rely on the deployment of large-scale land-related measures like afforestation and bioenergy supply, which, if poorly managed, can compete with food production and hence raise food security concerns (high confidence). The impacts of carbon dioxide removal (CDR) options on SDGs depend on the type of options and the scale of deployment (high confidence). If poorly implemented, CDR options such as BECCS and AFOLU options would lead to trade-offs. Context-relevant design and implementation requires considering people’s needs, biodiversity, and other sustainable development dimensions (very high confidence). (Figure SPM.4) {5.4.1.3, Cross-Chapter Box 7 in Chapter 3}

D.4.4. Mitigation consistent with 1.5°C pathways creates risks for sustainable development in regions with high dependency on fossil fuels for revenue and employment generation (high confidence). Policies that promote diversification of the economy and the energy sector can address the associated challenges (high confidence). {5.4.1.2, Box 5.2}

D.4.5. Redistributive policies across sectors and populations that shield the poor and vulnerable can resolve trade-offs for a range of SDGs, particularly hunger, poverty and energy access. Investment needs for such complementary policies are only a small fraction of the overall mitigation investments in 1.5°C pathways. (high confidence) {2.4.3, 5.4.2, Figure 5.5} 

Figure SPM.4

Potential synergies and trade-offs between the sectoral portfolio of climate change mitigation options and the Sustainable Development Goals (SDGs). The SDGs serve as an analytical framework for the assessment of the different sustainable development dimensions, which extend beyond the time frame of the 2030 SDG targets. The assessment is based on literature on mitigation options […]

Potential synergies and trade-offs between the sectoral portfolio of climate change mitigation options and the Sustainable Development Goals (SDGs). The SDGs serve as an analytical framework for the assessment of the different sustainable development dimensions, which extend beyond the time frame of the 2030 SDG targets. The assessment is based on literature on mitigation options that are considered relevant for 1.5°C. The assessed strength of the SDG interactions is based on the qualitative and quantitative assessment of individual mitigation options listed in Table 5.2. For each mitigation option, the strength of
the SDG-connection as well as the associated confidence of the underlying literature (shades of green and red) was assessed. The strength of positive connections (synergies) and negative connections (trade-offs) across all individual options within a sector (see Table 5.2) are aggregated into sectoral potentials for the whole mitigation portfolio. The (white) areas outside the bars, which indicate no interactions, have low confidence due to the uncertainty and limited number of studies exploring indirect effects. The strength of the connection considers only the effect of mitigation and does not include benefits of avoided impacts. SDG 13 (climate action) is not listed because mitigation is being considered in terms of interactions with SDGs and not vice versa. The bars denote the strength of the connection, and do not consider the strength of the impact on the SDGs. The energy demand sector comprises behavioural responses, fuel switching and efficiency options in the transport, industry and building sector as well as carbon capture options in the industry sector. Options assessed in the energy supply sector comprise biomass and non-biomass renewables, nuclear, carbon capture and storage (CCS) with bioenergy, and CCS with fossil fuels. Options in the land sector comprise agricultural and forest options, sustainable diets and reduced food waste, soil sequestration, livestock and manure management, reduced deforestation, afforestation and reforestation, and responsible sourcing. In addition to this figure, options in the ocean sector are discussed in the underlying report. {5.4, Table 5.2, Figure 5.2}

Information about the net impacts of mitigation on sustainable development in 1.5°C pathways is available only for a limited number of SDGs and mitigation options. Only a limited number of studies have assessed the benefits of avoided climate change impacts of 1.5°C pathways for the SDGs, and the co-effects of adaptation for mitigation and the SDGs. The assessment of the indicative mitigation potentials in Figure SPM.4 is a step further from AR5 towards a more comprehensive and integrated assessment in the future.

D.5. Limiting the risks from global warming of 1.5°C in the context of sustainable development and poverty eradication implies system transitions that can be enabled by an increase of adaptation and mitigation investments, policy instruments, the acceleration of technological innovation and behaviour changes (high confidence). {2.3, 2.4, 2.5, 3.2, 4.2, 4.4, 4.5, 5.2, 5.5, 5.6}

D.5.1. Directing finance towards investment in infrastructure for mitigation and adaptation could provide additional resources. This could involve the mobilization of private funds by institutional investors, asset managers and development or investment banks, as well as the provision of public funds. Government policies that lower the risk of low-emission and adaptation investments can facilitate the mobilization of private funds and enhance the effectiveness of other public policies. Studies indicate a number of challenges, including access to finance and mobilization of funds. (high confidence) {2.5.1, 2.5.2, 4.4.5}

D.5.2. Adaptation finance consistent with global warming of 1.5°C is difficult to quantify and compare with 2°C. Knowledge gaps include insufficient data to calculate specific climate resilience-enhancing investments from the provision of currently underinvested basic infrastructure. Estimates of the costs of adaptation might be lower at global warming of 1.5°C than for 2°C. Adaptation needs have typically been supported by public sector sources such as national and subnational government budgets, and in developing countries together with support from development assistance, multilateral development banks, and United Nations Framework Convention on Climate Change channels (medium confidence). More recently there is a growing understanding of the scale and increase in non-governmental organizations and private funding in some regions (medium confidence). Barriers include the scale of adaptation financing, limited capacity and access to adaptation finance (medium confidence). {4.4.5, 4.6}

D.5.3. Global model pathways limiting global warming to 1.5°C are projected to involve the annual average investment needs in the energy system of around 2.4 trillion USD2010 between 2016 and 2035, representing about 2.5% of the world GDP (medium confidence). {4.4.5, Box 4.8}

D.5.4. Policy tools can help mobilize incremental resources, including through shifting global investments and savings and through market and non-market based instruments as well as accompanying measures to secure the equity of the transition, acknowledging the challenges  related with implementation, including those of energy costs, depreciation of assets and impacts on international competition, and utilizing the opportunities to maximize co-benefits (high confidence). {1.3.3, 2.3.4, 2.3.5, 2.5.1, 2.5.2, Cross-Chapter Box 8 in Chapter 3, Cross-Chapter Box 11 in Chapter 4, 4.4.5, 5.5.2}

D.5.5. The systems transitions consistent with adapting to and limiting global warming to 1.5°C include the widespread adoption of new and possibly disruptive technologies and practices and enhanced climate-driven innovation. These imply enhanced technological innovation capabilities, including in industry and finance. Both national innovation policies and international cooperation can contribute to the development, commercialization and widespread adoption of mitigation and adaptation technologies. Innovation policies may be more effective when they combine public support for research and development with policy mixes that provide incentives for technology diffusion. (high confidence) {4.4.4, 4.4.5}.

D.5.6. Education, information, and community approaches, including those that are informed by indigenous knowledge and local knowledge, can accelerate the wide-scale behaviour changes consistent with adapting to and limiting global warming to 1.5°C. These approaches are more effective when combined with other policies and tailored to the motivations, capabilities and resources of specific actors and contexts (high confidence). Public acceptability can enable or inhibit the implementation of policies and measures to limit global warming to 1.5°C and to adapt to the consequences. Public acceptability depends on the individual’s evaluation of expected policy consequences, the perceived fairness of the distribution of these consequences, and perceived fairness of decision procedures (high confidence). {1.1, 1.5, 4.3.5, 4.4.1, 4.4.3, Box 4.3, 5.5.3, 5.6.5}

D.6. Sustainable development supports, and often enables, the fundamental societal and systems transitions and transformations that help limit global warming to 1.5°C. Such changes facilitate the pursuit of climate-resilient development pathways that achieve ambitious mitigation and adaptation in conjunction with poverty eradication and efforts to reduce inequalities (high confidence). {Box 1.1, 1.4.3, Figure 5.1, 5.5.3, Box 5.3}

D.6.1. Social justice and equity are core aspects of climate-resilient development pathways that aim to limit global warming to 1.5°C as they address challenges and inevitable trade-offs, widen opportunities, and ensure that options, visions, and values are deliberated, between and within countries and communities, without making the poor and disadvantaged worse off (high confidence). {5.5.2, 5.5.3, Box 5.3, Figure 5.1, Figure 5.6, Cross-Chapter Boxes 12 and 13 in Chapter 5}

D.6.2. The potential for climate-resilient development pathways differs between and within regions and nations, due to different development contexts and systemic vulnerabilities (very high confidence). Efforts along such pathways to date have been limited (medium confidence) and enhanced efforts would involve strengthened and timely action from all countries and non-state actors (high confidence). {5.5.1, 5.5.3, Figure 5.1}

D.6.3. Pathways that are consistent with sustainable development show fewer mitigation and adaptation challenges and are associated with lower mitigation costs. The large majority of modelling studies could not construct pathways characterized by lack of international cooperation, inequality and poverty that were able to limit global warming to 1.5°C. (high confidence) {2.3.1, 2.5.1, 2.5.3, 5.5.2}

D.7. Strengthening the capacities for climate action of national and sub-national authorities, civil society, the private sector, indigenous peoples and local communities can support the implementation of ambitious actions implied by limiting global warming to 1.5°C (high confidence). International cooperation can provide an enabling environment for this to be achieved in all countries and for all people, in the context of sustainable development. International cooperation is a critical enabler for developing countries and vulnerable regions (high confidence). {1.4, 2.3, 2.5, 4.2, 4.4, 4.5, 5.3, 5.4, 5.5, 5.6, 5, Box 4.1, Box 4.2, Box 4.7, Box 5.3, Cross-Chapter Box 9 in Chapter 4, Cross-Chapter Box 13 in Chapter 5}

D.7.1. Partnerships involving non-state public and private actors, institutional investors, the banking system, civil society and scientific institutions would facilitate actions and responses consistent with limiting global warming to 1.5°C (very high confidence). {1.4, 4.4.1, 4.2.2, 4.4.3, 4.4.5, 4.5.3, 5.4.1, 5.6.2, Box 5.3}.

D.7.2. Cooperation on strengthened accountable multilevel governance that includes non-state actors such as industry, civil society and scientific institutions, coordinated sectoral and cross-sectoral policies at various governance levels, gender-sensitive policies, finance including innovative financing, and cooperation on technology development and transfer can ensure participation, transparency, capacity building and learning among different players (high confidence). {2.5.1, 2.5.2, 4.2.2, 4.4.1, 4.4.2, 4.4.3, 4.4.4, 4.4.5, 4.5.3, Cross-Chapter Box 9 in Chapter 4, 5.3.1, 5.5.3, Cross-Chapter Box 13 in Chapter 5, 5.6.1, 5.6.3}

D.7.3. International cooperation is a critical enabler for developing countries and vulnerable regions to strengthen their action for the implementation of 1.5°C-consistent climate responses, including through enhancing access to finance and technology and enhancing domestic capacities, taking into account national and local circumstances and needs (high confidence). {2.3.1, 2.5.1, 4.4.1, 4.4.2, 4.4.4, 4.4.5, 5.4.1 5.5.3, 5.6.1, Box 4.1, Box 4.2, Box 4.7}.

D.7.4. Collective efforts at all levels, in ways that reflect different circumstances and capabilities, in the pursuit of limiting global warming to 1.5°C, taking into account equity as well as effectiveness, can facilitate strengthening the global response to climate change, achieving sustainable development and eradicating poverty (high confidence). {1.4.2, 2.3.1, 2.5.1, 2.5.2, 2.5.3, 4.2.2, 4.4.1, 4.4.2, 4.4.3, 4.4.4, 4.4.5, 4.5.3, 5.3.1, 5.4.1, 5.5.3, 5.6.1, 5.6.2, 5.6.3}

+

Core Concepts Central to this Special Report

+

Acknowledgements

We are very grateful for the expertise, rigour and dedication shown throughout by the volunteer Coordinating Lead Authors and Lead Authors, working across scientific disciplines in each chapter of the report, with essential help by the many Contributing Authors. The Review Editors have played a critical role in assisting the author teams and ensuring the integrity of the review process. We express our sincere appreciation to all the expert and government reviewers. A special thanks goes to the Chapter Scientists of this Report who went above and beyond what was expected of them: Neville Ellis, Tania Guillén Bolaños, Daniel Huppmann, Kiane de Kleijne, Richard Millar and Chandni Singh.

We would also like to thank the three Intergovernmental Panel on Climate Change (IPCC) Vice-Chairs Ko Barrett, Thelma Krug, and Youba Sokona as well as the members of the WGI, WGII and WGIII Bureaux for their assistance, guidance, and wisdom throughout the preparation of the Report: Amjad Abdulla, Edvin Aldrian, Carlo Carraro, Diriba Korecha Dadi, Fatima Driouech, Andreas Fischlin, Gregory Flato, Jan Fuglestvedt, Mark Howden, Nagmeldin G. E. Mahmoud, Carlos Mendez, Joy Jacqueline Pereira, Ramón Pichs-Madruga, Andy Reisinger, Roberto Sánchez Rodríguez, Sergey Semenov, Muhammad I. Tariq, Diana Ürge-Vorsatz, Carolina Vera, Pius Yanda, Noureddine Yassaa, and Taha Zatari.

Our heartfelt thanks go to the hosts and organizers of the scoping meeting, the four Special Report on 1.5°C Lead Author Meetings and the 48th Session of the IPCC. We gratefully acknowledge the support from the host countries and institutions: World Meteorological Organization, Switzerland; Ministry of Foreign Affairs, and the National Institute for Space Research (INPE), Brazil; Met Office and the University of Exeter, the United Kingdom; Swedish Meteorological and Hydrological Institute (SMHI), Sweden; the Ministry of Environment Natural Resources Conservation and Tourism, the National Climate Change Committee in the Department of Meteorological Services and the Botswana Global Environmental Change Committee at the University of Botswana, Botswana; and Korea Meteorological Administration (KMA) and Incheon Metropolitan City, the Republic of Korea. The support provided by governments and institutions, as well as through contributions to the IPCC Trust Fund, is thankfully acknowledged as it enabled the participation of the author teams in the preparation of the Report. The efficient operation of the Working Group I Technical Support Unit was made possible by the generous financial support provided by the government of France and administrative and information technology support from the Université Paris Saclay (France), Institut Pierre Simon Laplace (IPSL) and the Laboratoire des Sciences du Climat et de l’Environnement (LSCE). We thank the Norwegian Environment Agency for supporting the preparation of the graphics for the Summary for Policymakers. We thank the UNEP Library, who supported authors throughout the drafting process by providing literature for the assessment.

We would also like to thank Abdalah Mokssit, Secretary of the IPCC, and the staff of the IPCC Secretariat: Kerstin Stendahl, Jonathan Lynn, Sophie Schlingemann, Judith Ewa, Mxolisi Shongwe, Jesbin Baidya, Werani Zabula, Nina Peeva, Joelle Fernandez, Annie Courtin, Laura Biagioni and Oksana Ekzarkho. Thanks are due to Elhousseine Gouaini who served as the conference officer for the 48th Session of the IPCC.

Finally, our particular appreciation goes to the Working Group Technical Support Units whose tireless dedication, professionalism and enthusiasm led the production of this Special Report. This Report could not have been prepared without the commitment of members of the Working Group I Technical Support Unit, all new to the IPCC, who rose to the unprecedented Sixth Assessment Report challenge and were pivotal in all aspects of the preparation of the Report: Yang Chen, Sarah Connors, Melissa Gomis, Elisabeth Lonnoy, Robin Matthews, Wilfran Moufouma-Okia, Clotilde Péan, Roz Pidcock, Anna Pirani, Nicholas Reay, Tim Waterfield, and Xiao Zhou. Our warmest thanks go to the collegial and collaborative support provided by Marlies Craig, Andrew Okem, Jan Petzold, Melinda Tignor and Nora Weyer from the WGII Technical Support Unit and Bhushan Kankal, Suvadip Neogi and Joana Portugal Pereira from the WGIII Technical Support Unit. A special thanks goes to Kenny Coventry, Harmen Gudde, Irene Lorenzoni, and Stuart Jenkins for their support with the figures in the Summary for Policymakers, as well as Nigel Hawtin for graphical support of the Report. In addition, the following contributions are gratefully acknowledged: Jatinder Padda (copy edit), Melissa Dawes (copy edit), Marilyn Anderson (index), Vincent Grégoire (layout) and Sarah le Rouzic (intern).

The Special Report website has been developed by Habitat 7, led by Jamie Herring, and the report content has been prepared and managed for the website by Nicholas Reay and Tim Waterfield. We gratefully acknowledge the UN Foundation for supporting the website development.

Date of Summary for Policymakers: 6 October 2018

+

Citation

This Summary for Policymakers should be cited as:

IPCC, 2018: Summary for Policymakers. In: Global Warming of 1.5°C. An IPCC Special Report on the impacts of global warming of 1.5°C above pre-industrial levels and related global greenhouse gas emission pathways, in the context of strengthening the global response to the threat of climate change, sustainable development, and efforts to eradicate poverty [Masson-Delmotte, V., P. Zhai, H.-O. Pörtner, D. Roberts, J. Skea, P.R. Shukla, A. Pirani, W. Moufouma-Okia, C. Péan, R. Pidcock, S. Connors, J.B.R. Matthews, Y. Chen, X. Zhou, M.I. Gomis, E. Lonnoy, T. Maycock, M. Tignor, and T. Waterfield (eds.)]. Cambridge University Press, Cambridge, UK and New York, NY, USA, pp. 3-24, doi:10.1017/9781009157940.001.

SD

SPM Downloads

In this section, you will find all of the documents available to download for the Summary for Policymakers.

Final Report

Summary for Policymakers – Download High Res, Download Low Res

Summary for Policymakers (stand alone version) – Download High Res, Download Low Res 


SPM in UN Languages

French – Download – Download Errata
Chinese – Download
Russian – Download
Spanish – Download
Arabic – Download

SPM in Other Languages

A number of countries are undertaking translations of the SR1.5 SPM into languages that are not official languages of the United Nations. IPCC welcomes these initiatives but would note that the translations are prepared under the responsibility of the respective country or institutions. The IPCC does not assume any responsibility for the accuracy of these translations into non-UN languages. In working to achieve the widest possible dissemination of IPCC knowledge, the IPCC is pleased to assist in making these translations available.

German (Eine Version im offiziellen Layout folgt in Kürze) – Download

Portuguese – Download

Swedish – Download

Draft submitted to 48th Session of IPCC

Summary For Policy Makers – Download

Final Government Draft

Summary For Policy Makers – Download

Review Comments  – Download

First Order Draft

Summary For Policy Makers – Download

Review Comments and Responses – Download

Footnotes

  1. Decision 1/CP.21, paragraph 21.
  2. The assessment covers literature accepted for publication by 15 May 2018.
  3. Each finding is grounded in an evaluation of underlying evidence and agreement. A level of confidence is expressed using five qualifiers: very low, low, medium, high and very high, and typeset in italics, for example, medium confidence. The following terms have been used to indicate the assessed likelihood of an outcome or a result: virtually certain 99–100% probability, very likely 90–100%, likely 66–100%, about as likely as not 33–66%, unlikely 0–33%, very unlikely 0–10%, exceptionally unlikely 0–1%. Additional terms (extremely likely 95–100%, more likely than not >50–100%, more unlikely than likely 0–<50%, extremely unlikely 0–5%) may also be used when appropriate. Assessed likelihood is typeset in italics, for example, very likely. This is consistent with AR5.
  4.  See also Box SPM.1: Core Concepts Central to this Special Report.
  5. Present level of global warming is defined as the average of a 30-year period centred on 2017 assuming the recent rate of warming continues.
  6. This range spans the four available peer-reviewed estimates of the observed GMST change and also accounts for additional uncertainty due to possible short-term natural variability. {1.2.1, Table 1.1}
  7. Robust is here used to mean that at least two thirds of climate models show the same sign of changes at the grid point scale, and that differences in large regions are statistically significant.
  8. Projected changes in impacts between different levels of global warming are determined with respect to changes in global mean surface air temperature.
  9. Projected changes in impacts between different levels of global warming are determined with respect to changes in global mean surface air temperature.
  10. Consistent with earlier studies, illustrative numbers were adopted from one recent meta-study.
  11. Here, impacts on economic growth refer to changes in gross domestic product (GDP). Many impacts, such as loss of human lives, cultural heritage and ecosystem services, are difficult to value and monetize.
  12. References to pathways limiting global warming to 2°C are based on a 66% probability of staying below 2°C.
  13. Non-CO2 emissions included in this Report are all anthropogenic emissions other than CO2 that result in radiative forcing. These include short-lived climate forcers, such as methane, some fluorinated gases, ozone precursors, aerosols or aerosol precursors, such as black carbon and sulphur dioxide, respectively, as well as long-lived greenhouse gases, such as nitrous oxide or some fluorinated gases. The radiative forcing associated with non-CO2 emissions and changes in surface albedo is referred to as non-CO2 radiative forcing. {2.2.1}
  14. There is a clear scientific basis for a total carbon budget consistent with limiting global warming to 1.5°C. However, neither this total carbon budget nor the fraction of this budget taken up by past emissions were assessed in this Report.
  15. Irrespective of the measure of global temperature used, updated understanding and further advances in methods have led to an increase in the estimated remaining carbon budget of about 300 GtCO2 compared to AR5. (medium confidence) {2.2.2}
  16. These estimates use observed GMST to 2006–2015 and estimate future temperature changes using near surface air temperatures.
  17. The projected land-use changes presented are not deployed to their upper limits simultaneously in a single pathway.
  18. Including two pathways limiting warming to 1.5°C with no or limited overshoot and four pathways with higher overshoot.
  19. GHG emissions have been aggregated with 100-year GWP values as introduced in the IPCC Second Assessment Report.
  20. Past IPCC reports, reflecting the literature, have used a variety of approximately equivalent metrics of GMST change.    

Framing and Context